TLDR: if you want to be funny (at least on Yelp), go to the worst restaurants with your significant other (and pet?) and write a deeply personal account of how this traumatic experience has affected your life.
Humor is a great way to connect with people, it lets them know that you’re probably a charming yet harmless clown, so you can punch them in the spleen while their guard is down POW (just kidding). How to be funny, you ask? Well, in our great big world of technology today, how else do we learn, but to let the machines tell us what we want to know. But for machines to learn, it needs lots and lots data, and in our specific case, data about what PEOPLE find funny and what they do not.
Yelp Dataset
Enter the Yelp Dataset Challenge. If you’re an avid foodie or simply terrible at making your own meal decisions, you would be familiar with Yelp. If you really live under a rock, check it out here. This amazing website aggregates the opinion of many amateur critics of restaurants (and other businesses) so you can spend half an hour getting informed about which taco place is the best instead of just walking down the street like normal people use to do. Nonetheless, some of these reviews are pretty detailed and entertaining, so Yelp decided that they needed reviews to be reviewed (yodawg), via a simple interface a la the vote bar. And this is exactly the data we will use for today’s exercise (read: last month’s assignment). The Yelp Dataset Challenge provides a million or so reviews, each of which has the full text, as well the number of votes it got in each of the 3 categories: useful, funny, cool. Side note, I totally get why “Useful” is a button, just like Amazon’s “helpfulness” vote. But “Funny” and “Cool”? What purpose could these votes possibly serve in informing my decision about the restaurant? Well, one man’s useless musing is another man’s treasure cove of data. What we will do, then, is to correlate the review text with the funniness vote, and see what kind of text features are most likely judged as funny.
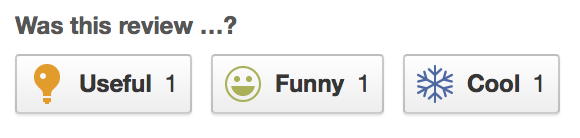 Yelp Review Review Bar. I’m a review and i want you to review me
Regressing for Funniness
The model I use is nice and simple: (ridge) regression with bag of words
(monogram and bigram) features and 4-fold validation. If you’re familiar with
what these are, or just plain uninterested, skip to the results section. If
not, I will give my best attempt to explain what these things are here.
Basically, I’m looking for single words and two-2 word phrases that most
commonly appear in funny reviews.
Bag of words : a bag of words is exactly what it sounds like, you take some text like a restaurant review, and simply count how many times each word occurred in that piece of text. In other words, you toss all the words in a bag, losing its syntax, and just pull the words out one by one and tally when something has occurred. So for example, if “Mary had a little lamb and a big lamb.” is our text, then the words “lamb” and “a” would get 2 counts each, whereas the other words all get a 1. If this is too confusing or insufficiently detailed for your taste, check out the Wikipedia entry.
So what usually happens is that you would build a big dictionary of words from all of your text data, i.e. all one million reviews, which will literally be a list like [A, Aardvark, …, Lamb, … Mary, … Zebra], and each review is then represented as a count of how many times each word in the dictionary occurs. So for all the reviews, it would mostly contain zeros because the dictionary probably has upwards of a million words, but each review is only hundreds of words. This means that, given the big dictionary and a particular review’s feature vector, we can figure out exactly which words occur (and how many times) in this review, but not the order in which they appear. This is called a monogram feature, because MONO means 1 and we’re counting one word at a time. Bigram, as you can guess, is two words at a time, preserving its sequential ordering, so the above example would be [Mary had, had a, a little, little lamb…]. This is the bare minimum attempt at passing some grammar since “good” and “not good” obviously mean very different things, and we’d like to keep that. There are some more tricks that are often applied, such as throwing out punctuations and really common words (stopwords) like “the”, “and”, “a”, etc, as well as limiting the dictionary to only the most commonly seen words. For this analysis, I’m using the 1000 most common monograms and bigrams, after throwing out stopwords, so each review is represented by a list of 2000 numbers.
Regression : I will not attempt to teach the concept of regression in one paragraph, instead, I will just explain what the idea is in the context of what we’re trying to do here. From before, each review is represented as a list of 2000 numbers, denoting the occurrence of 1000 words and 1000 two-word phrases in each review. In addition, each review has a number representing how funny it is (e.g. the amount of “Funny” votes, and a variation we will later see). The goal of regression is then to correlate a list of words with its funniness, so that when presented with a brand new list (a new review), we can predict how funny it will be. This means that when specific words are present in all the funny reviews and not the un-funny ones, it should get a high “weight” (or “vote”) in determining how funny something is. For example, if you performed regression based on how much a 5-year-old laughs at sentences he hears, the word “fart” would probably have an extremely large weight, and “broccoli” would have a very small (or negative) weight. To make sure that the model has general validity (avoid overfitting), 4-fold validation simply means to split the data into quarters, and to train the regression model on 3/4 of the data and test (predict) on the remaining quarter, in order to find the best model in terms of prediction accuracy. Therefore, the goal of this exercise is to see which words have the highest weights (in the best model) in regressing for funniness, as learned from the Yelp dataset.
There are plenty of more sophisticated and possibly more relevant models out there (ALL ABOARD THE DEEP/RECURRENT NET TRAIN CHOOCHOO), but this was sufficient for me passing the course. Plus, I actually really just wanted to see which words and phrases would be deemed funny in this context, throwing away all other information, so that one day if I was restricted to writing and speaking in single words, I don’t have to say “fart” all the time to be funny.
So how to be funny?
1. Everything is funnier when you’re popular.
As you may recall, how I defined funniness here is how many “Funny” votes a
review got. This definition has problems right off the bat. For one, a review
is more likely to have more votes the older it is, such that for two reviews
of similar objective funniness, the older one will have more votes. We don’t
want that. Secondly, and more importantly, Yelp has an integrated social
network platform, so that reviewers can be friends with other reviewers, which
means that reviewers with more connections will get more exposure for their
reviews, hence more votes. In a similar vein, Yelp places more helpful/popular
reviews near the top of a restaurant’s page with their Yelp Sort algorithm,
which is great for users but bad for judging funniness because the more
exposure a review gets, the more likely it is to be visible, thus more likely
to be voted on, and the cycle continues.
This is bad, because if we tried to learn how funny a review is based on the raw count, and a few of them have WAY more votes (orders of magnitude), then the model will simply ignore the vast majority of the data in favor of these selected few. I don’t even need to put these through the regression to know that it will be badly biased by a few reviews with a disproportional amount of votes. How disproportional?
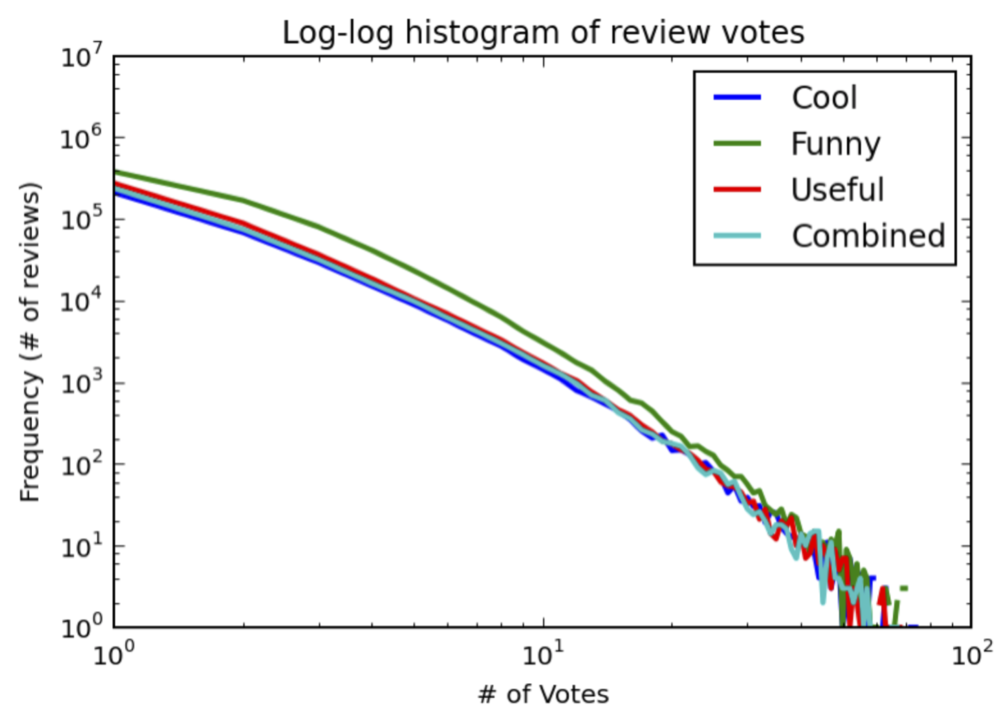 Number of reviews with a specified number of votes. Note the log-log scale.
Above is a histogram showing how many reviews have a certain number of votes ( NOTE the log-log scale. e.g. 1000 reviews have 10 Funny votes, about 100 has 20). Histograms are usually drawn with bars, but it’s ugly on a log-log scale, and the idea is the same, the line just connects where the top of the bars would have been. Anyway, what this shows is that a small number of reviews have a LOT of votes compared to the vast majority (less than 10 votes), which creates the problem I described above. Worse yet, the “funny” reviews are probably not that funny, because the pairwise correlation between each pair of the 3 categories are 0.73, 0.80, and 0.84, meaning that what’s voted as funny by lots of people is also likely to be voted as useful and cool. This means that what’s voted as funny is not simply due to the review’s own merit, but more likely it’s popularity. In other words, just by looking at how many total votes (or any of the non-funny votes) a review has, I can predict how many funny votes it got. I proclaim this to be the most profound lesson of the day: kids, it’s (probably) good to be popular. Now, you could reasonably argue that what’s popular is rightfully more funny than what no one cares to read, in which case you were probably popular in high school and I would object by referring you to the first and last seasons of How I Met Your Mother.
To counter these issues, I calculate a F-Index (creative naming, I know), which is simply calculated as F-Index = (Funny - (Cool+Useful)/2). In plain English, the F-Index measures how much more do people perceive a review as funny than useful and cool. This is a simple way to normalize by popularity, so to speak, as well as shrinking the gap of funniness. As an example, imagine two reviews with votes [1,7,3] and [100,102,98] (for [cool, funny, useful] ), if we just used the raw votes, the second review would be considerably more funny than the first (7 vs. 102). But if we take the F-Index, they would have 7-(1+3)/2 = 5 and 3 respectively, which means that the first is actually funnier. This appeals to intuition because if people are reading these reviews and actively decide to cast their votes in Funny only, then it should be considered funny, no matter how many total votes it has. This, of course, biases against reviews that are truly as funny as they are useful (and cool, whatever that means), but hey, I had to hand in something.
2. Be polarizing, personal…and suffer with your spouse
Now that I have a metric that I’m happy with, I can just churn the data
through the model. If you’re wondering, I’m using Python. I was going to
upload the code on GitHub, then I realized that it is so poorly written that
it would seriously put a dent on the probability of me ever getting a
professional coding job, and I am nowhere near motivated enough to actually
clean it up. Nevertheless, if for whatever reason you’re interested in the
iPython Notebook code, message me and I will gladly share.
Here comes the big reveal…drumroll!
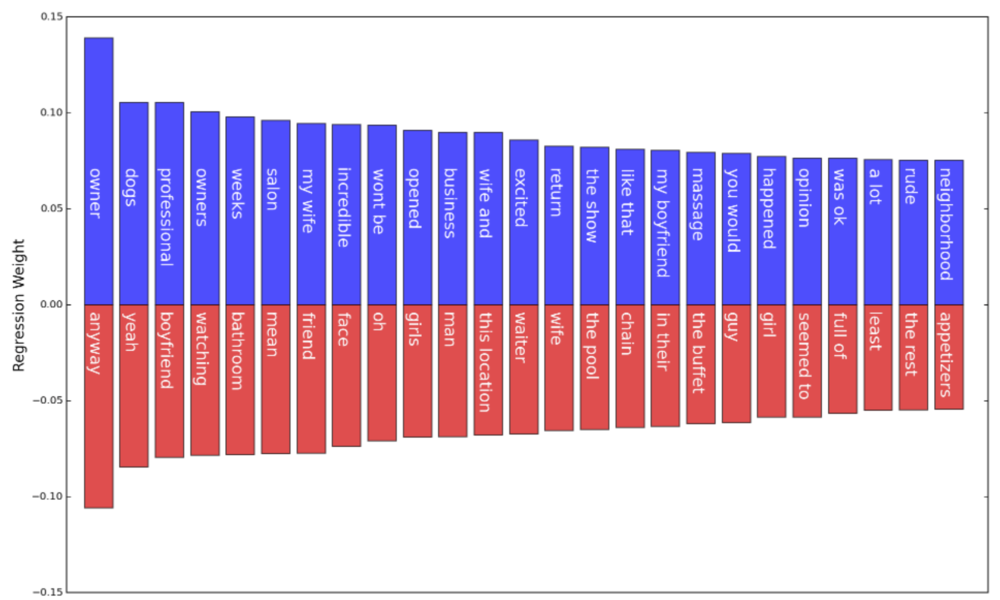
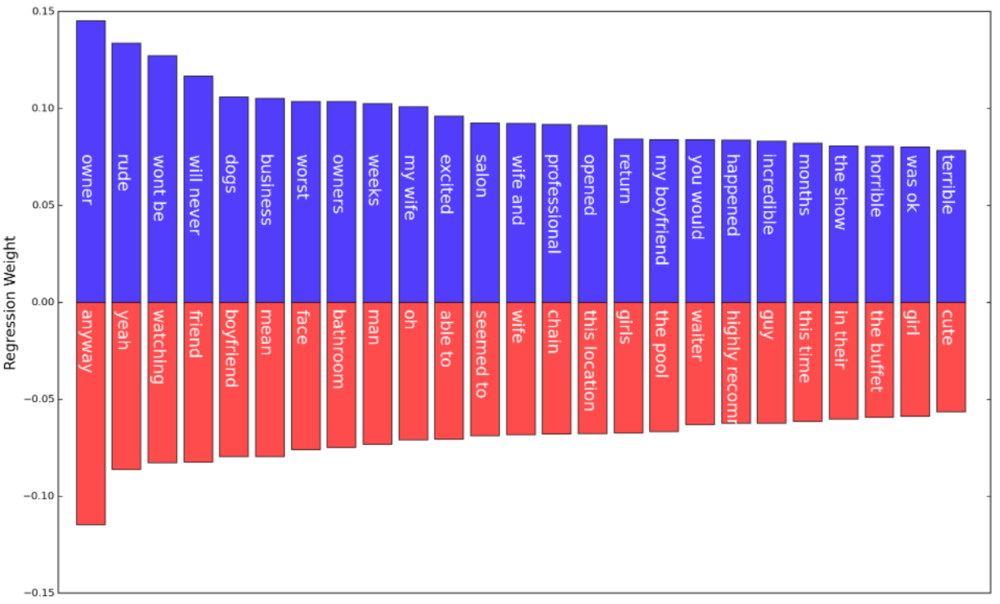 Top & Bottom 25 Regression weights and their phrase.
Above are 50 unigrams/bigrams that are the most associative of a review’s funniness (positively, blue; negatively, red, 25 each), i.e., this set of words tend to appear in reviews that are the most/least funny.
The results are quite interesting, just by seeing which words come out on top. Out of 25, 6 of them connote some kind of extreme negativity (rude, won’t be, will never [return], worst, terrible, horrible), whereas none appeared in the least funny reviews. I can buy this: anecdotally, people usually laugh at self-deprecating jokes (which might be hard to do on a restaurant review) or extraordinary complaints, so going to a shitty restaurant and then writing about it might have a good chance of making someone laugh. On the flip side, “incredible” and “excited” connote positive responses, so it appears that not only do very bad experiences make for funny stories, but good ones as well (though less so). Other things of note: owner/owners are apparently funny words in the right context, probably referring to a rude owner. Also, my wife/wife and/my boyfriend also placed in the top 25, so it appears that taking your significant other at a time of suffering is humorous. Although, you can see that both “wife” and “boyfriend” appear in the bottom 25 words - how does this make sense? One possibility is that those refer to someone else’s boyfriend and wife, but that feels like a bit of a stretch. Deeper analysis is required here, my guess is that it’s due to the regression balancing the weights on what is only sometimes funny. In general, though, it seems that the least funny words are rarely descriptive (adjectives), which by nature makes them neutral (with the exception of, possibly, “highly recommend”) and also impersonal. So, it appears that the takeaway is to be polarizing and subjective in your reviews, and involve your loved ones (wife and dogs, apparently).
3. Be honest
As we discovered above, extremely good and bad experiences seem to make for a
good laugh, so what if we take that into consideration in our model? To do
that, I simply added two more features into the 2000-dimension vector, the
restaurant rating and rating squared, and the regression will take care of it
automatically. This means that we don’t need to depend on the sentiment of the
phrases to tell us about the experience anymore, and so there may be more
informative words that will appear after having accounted for it. Indeed, the
regression weights for the dimension representing rating (and squared) were
much higher (not shown) than any of the subsequent weights representing
unigram/bigram features, which means that, as we predicted, the funniness of a
review is firstly a function of the rating it gave out.
 TOP & BOTTOM 25 regression weights, accounting for review rating.
Having accounted for the quality of the experience, we can take a look at how the weights of the most correlative words/phrases changed. The most striking change, I think, is the downgraded importance of bad adjectives, where “rude” was the only one from before that still remained in the top 25, though its weight significantly decreased. This means that, having accounted for the quality of the restaurant experience, these extreme adjectives are not so helpful in judging funniness anymore, because they mostly convey the same information. Also, this means that simply being harsh is not enough to be funny. Or rather, no one in their right mind describes a treacherous experience but gave it a good star rating, at least in this dataset. We can’t really say much about whether simply being critical would be funny, i.e., when the words are inconsistent with the rating, and the average rating of the restaurant, but that’s a good experiment someone else should do. Aside from the bad adjectives, the other top-weighted words largely remain unchanged, which suggests that they are independent of the quality of experience.
End Note
This whole exercise is obviously correlational, meaning I’m not promising that
if you write a scathing review of your neighborhood bad eats, it will be
perceived as funny, though the trend on Yelp suggests that it might, so take
from it what you will. Also, the analysis has many caveats and assumptions,
uses an extremely simple model, and throws away a lot of information (namely,
syntactical) to arrive at this conclusion. Given all that, however, it is a
little surprising that somebody in an academic setting has previously
published a paper
describing exactly these findings. In attempting to automatically classify
full-length articles (news & the Onion) as serious or humorous, these folks
found that the overwhelming majority of humorous articles 1) contain negative
sentiment and 2) are more human-centered [1]. Again, a computer science paper
and my hacked-together project do not give definitive answers on what is
funny, but seeing how they agree with each other and with our intuition, I
think it’s interesting that there is at least a vague sense of
generalizability on what we think to be funny or not.
[1] Mihalcea & Pulman.